21 OCTOBER 2019
A good diagram is worth 1000 words

How many times have I said to students “draw a diagram!”? How many times have I heard other teachers say the same thing while watching mechanics lessons? In my years of teaching and examining, this has been a continual refrain: students who do not draw a good diagram frequently get stuck on questions, and in an examination situation, they tend to get quite poor marks.
There is no magic fix for this, but in this post, I’d like to do two things:
- Suggest some possible teaching ideas
- Highlight some particularly common errors and give ways of avoiding them
Teaching ideas
An overarching thought is that we actually need to teach diagram-drawing in mechanics: it is not something that our students know how to do, and simply showing them diagrams is probably insufficient for them to learn how to draw their own.
Activity 1: Pick the best diagram
Inviting students to analyse diagrams can help focus their attention on what makes a good diagram. For example, which of the following diagrams is the most useful, correct diagram to help answer this question? What makes it useful and why are the others less useful?
A car is moving at a constant velocity of 10 m s-1 due North. It has a driving force of D and experiences resistive forces totalling 600 N. The weight of the car is 14 kN. Calculate D.
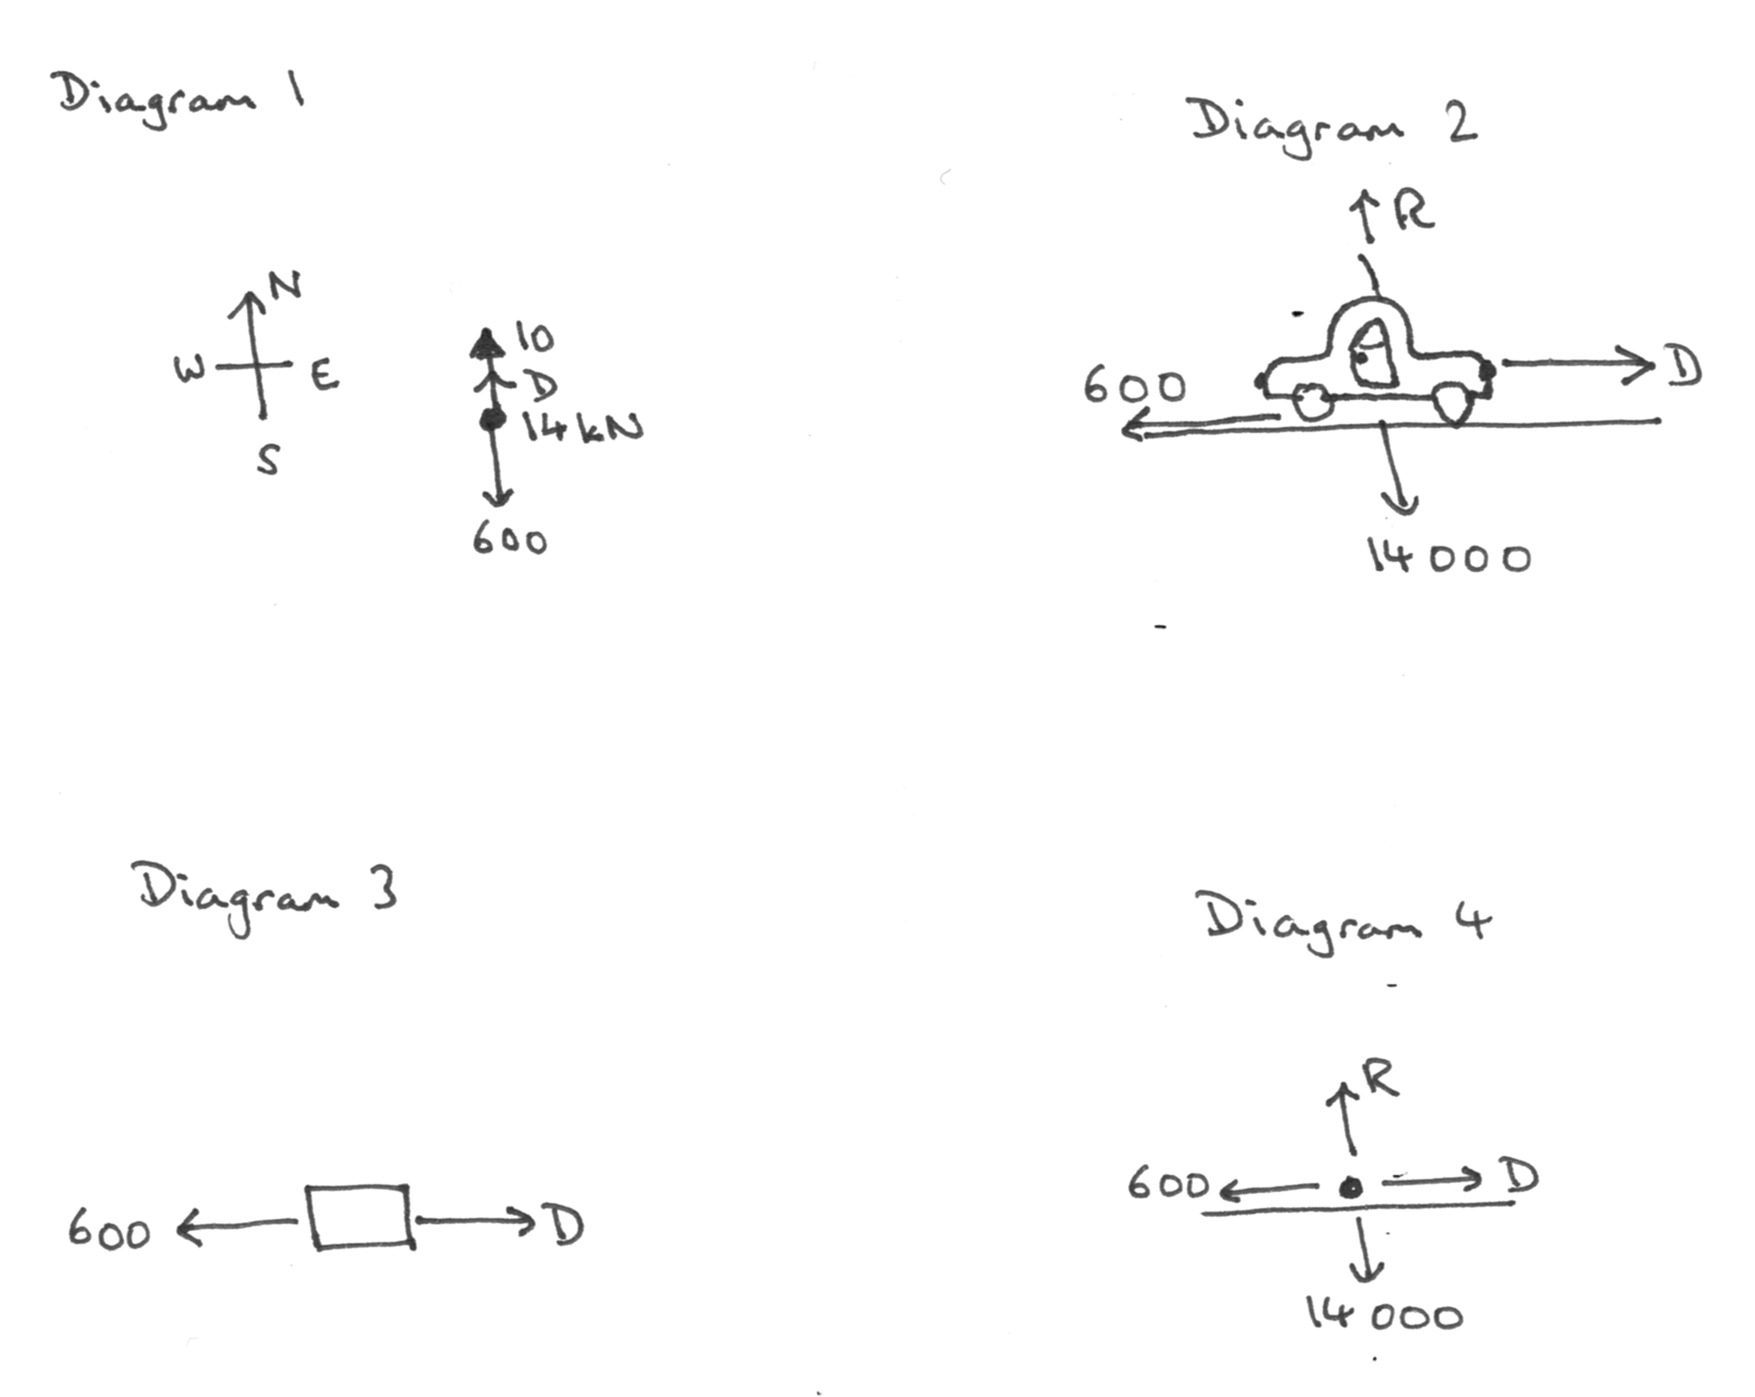
Note that these diagrams are deliberately hand-drawn, as they are the sort of thing that a student might draw in response to this question.
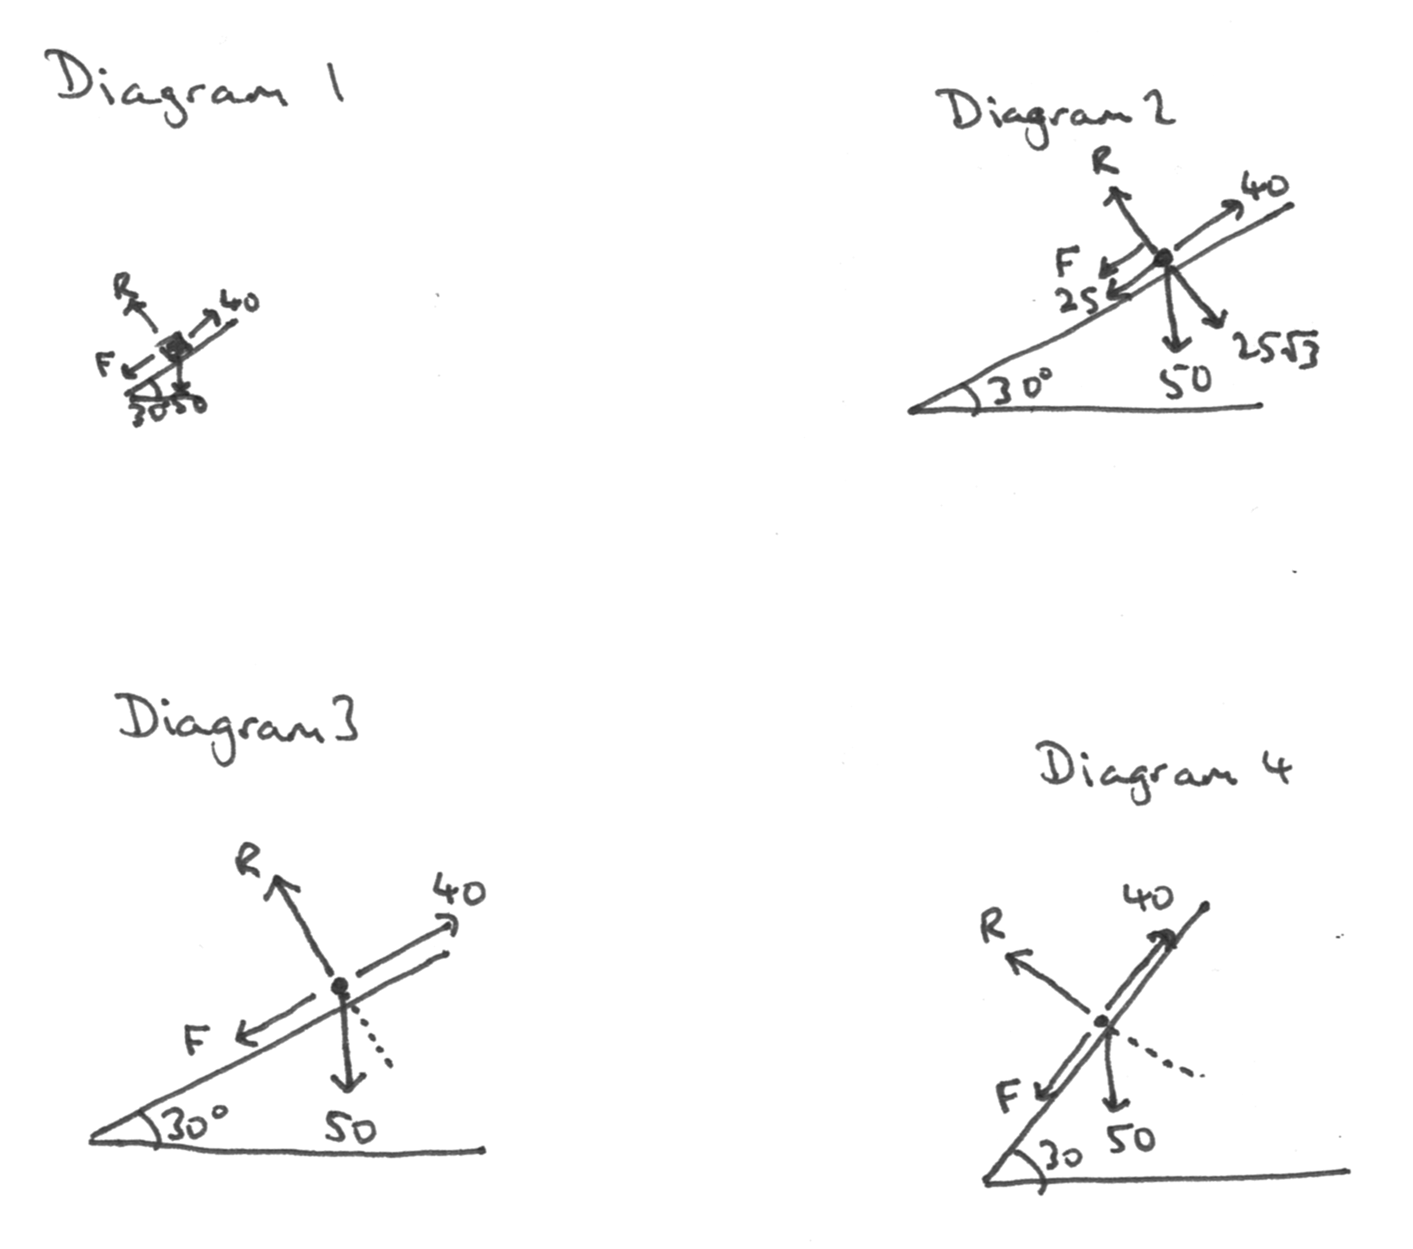
Another example is this question:
A parcel of mass 5 kg is dragged at constant speed up a slope inclined at an angle of 30° to the horizontal by a force of 40 N acting parallel to the slope. Find the friction force between the parcel and the slope.
Activity 2: Making diagram-drawing the focus
Usually, the drawing is just a step on the way to solving a question, and the focus is on the question. In this activity, select some questions from the coursebook, workbook or past examination papers, related to topics already studied. Provide students with the situation part of the question (but not the “work out”) part, and ask them to draw the corresponding diagram. For example, Exercise 4B, question 10 (page 94) from the Cambridge International AS & A Level Mathematics Mechanics Coursebook, could be presented as follows:
A downhill skier of mass 80 kg is accelerating down a rough slope of length 400 m at 22° to the horizontal. There is air resistance of 50 N and the coefficient of friction between the snow and the skis is 0.3. The skier is moving at 20 m s-1 at the top of the slope.
This is a moderately complex situation, involving three forces, a velocity, an unspecified acceleration and a distance. If you have a visualiser available, you can then display a few students’ work to the class and ask them to identify one good thing about each student’s diagram and one thing they would do differently.
You could take this further and ask students to work through a number of questions, drawing a useful diagram for each one (but not calculating anything).
Some potentially interesting follow-up pieces of work to the above example would include:
i. Asking students what they can work out from the given information (the question asked in the coursebook is only one such piece of information)
ii. Asking what would change in the diagram if some of the figures in the question changed, or if other aspects of the situation were to change
iii. Asking how the things they have worked out in (i) would change in these new scenarios – note that “would it increase or decrease?” is likely to be a more useful question than “what would the new value be?” as it requires reasoning about the situation rather than just plugging numbers into a formula
This diagram-drawing activity can be used at every stage of the course, whenever a new type of context or type of force is introduced.
Some common errors and how to avoid them
Drawing diagrams too small
If a diagram is too small, it is very easy to misread it. If a student finds themselves having to squeeze something into the diagram, or writing on top of arrows, they should redraw the diagram and make it larger.
Confusing arrows
When drawing a diagram, some students include both a force and its components, and then accidentally use the force twice in further calculations; this is obviously a bad idea! Either the components of a force should be drawn on the diagram, or the original force, but not both.
One exception to this is when a question is purely about calculating a resultant force. In such a case, the resultant could be distinguished by using a double-headed arrow.
A more common problem is becoming confused by having arrows representing different things on the same diagram, for example, forces, velocities, accelerations, distances (or displacements), and perhaps impulse or momentum.
A diagram is meant to be helpful and easy to read, so using consistent conventions can help. One that I have found very useful over many years is used by Quadling & Ramsay in their 1971 book Elementary Mechanics. They consistently used different types of arrowhead to indicate different types of quantity; this makes the meaning of the arrows instantly clearer. This convention is: Forces are always taken to be in newtons, so a force given as 7 N should be written as “7” rather than “7 N”; the latter could be misunderstood as 7 times the variable N. Likewise, an acceleration is always in m s-2, so a numerical acceleration might be written on a diagram as 1.2, but not as 1.2 m s-2.
Distance or displacement is a little harder to include; using something such as the following can make this clearly distinct from a force:

Getting signs wrong: positive directions
This is a very common error! Whenever drawing a diagram in which we are going to be doing Newton’s Second Law (F=ma) or displacement-velocity-acceleration calculations, it is vital to know which direction is being considered as positive. As an example, here is a question about constant acceleration:
A boy jumps vertically into a pool from a springboard 3 metres above the water. He jumps upwards at 0.5 m s-1. Find how long it takes for him to hit the water.
A common calculation, with or without a diagram, begins:
s = ut + ½ at2
3 = 0.5t + ½ × 10 × t2
after which the student goes on to solve this quadratic equation.
The following diagram might help students to avoid this error:
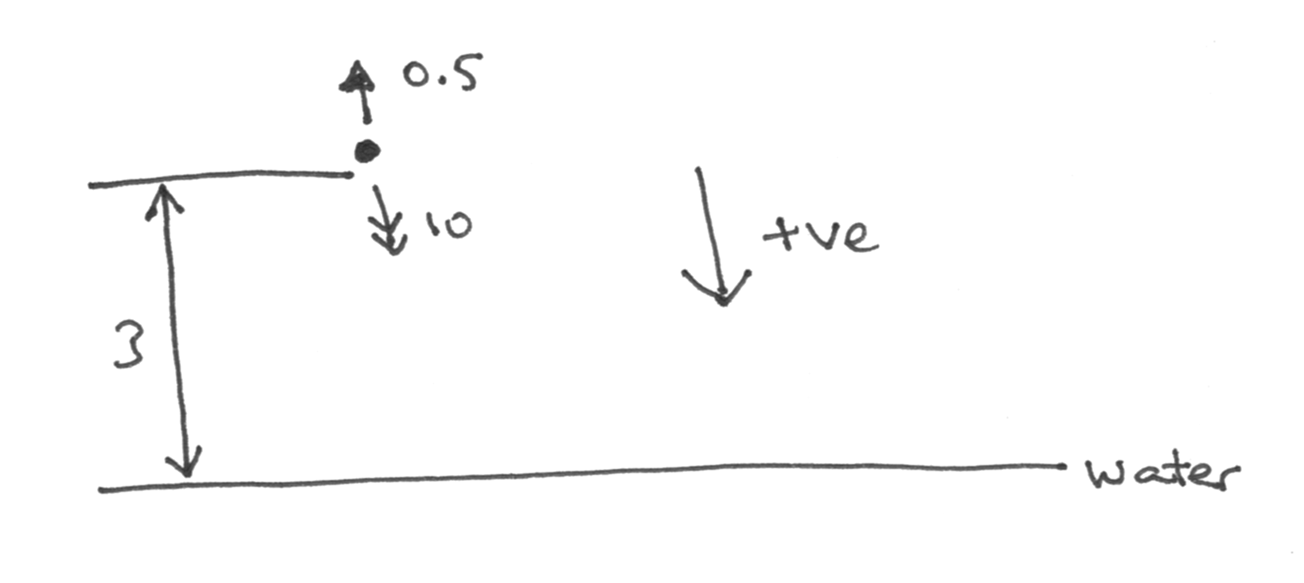
Note the prominent “+ve” direction arrow. Whenever using a force, velocity, acceleration, displacement or the like in a calculation, ask yourself the question “is this in the positive or negative direction?” In this case, the original velocity is in the negative direction, while the displacement and acceleration are in the positive direction, so the equation should read:
3 = -0.5t + ½ × 10 × t2
If we had taken positive to be upwards, then we would obtain the equivalent equation:
-3 = 0.5t + ½ × (-10) × t2
Getting signs wrong: collisions
An even more confusing case than the above is that of two colliding particles. In the A Level mechanics module, the only skill required is conservation of momentum, though further on in further mathematics, the coefficient of restitution is used. In that context, many students think of Newton’s Law of Restitution in the form “speed of separation = e × speed of approach”, but then have difficulties working out the two speeds in this equation, especially if the direction of one of the particles is unknown.
Here is an alternative approach to this scenario that always works. The diagram is always the same, with the velocities always pointing in the same directions:
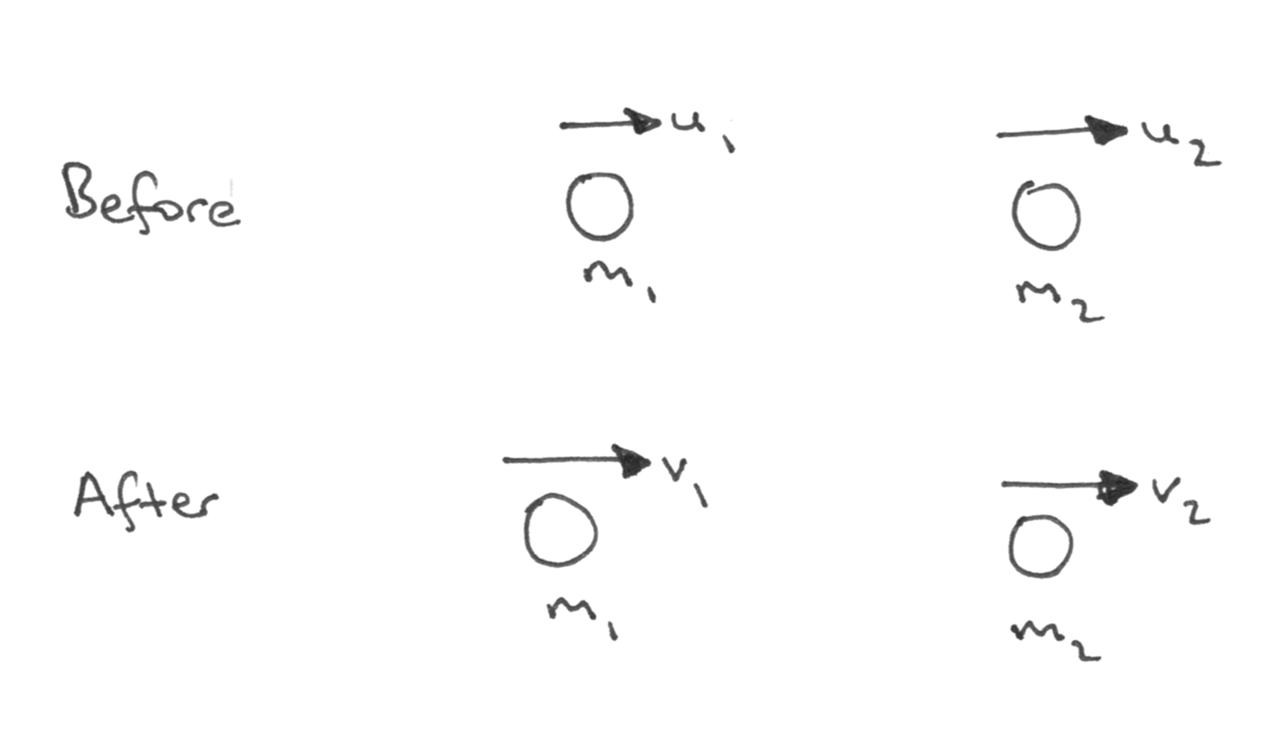
With this diagram, Newton’s Law of Restitution can always be written as:
v2 – v1 = e(u1 – u2)
Note that a velocity (such as u2) is negative if the particle is moving in the opposite direction, yet the equation remains the same. One of the wonderful things about algebra is that it handles such matters seamlessly, without having to think each time “do we add or subtract these speeds?”
We should note that in this setup, the conservation of momentum equation is always:
m1u1 + m2u2 = m1v1 + m2v2
Therefore to solve almost any one-dimensional collisions question, this diagram is drawn, the known values are written on it and then substituted into the above equations. The remaining work is usually then straightforward algebra. Two-dimensional collisions can be handled similarly.
Summary
Good, clear diagrams can make all of the difference between success and failure on mechanics questions. I hope that these ideas will be of benefit to your students as they study this most fascinating area of applied mathematics.
 |
About the author Julian Gilbey is currently a Research Associate at the University of Cambridge and a Director of Studies for Mathematics at Jesus College, Cambridge. He was formerly a Resource Designer for Underground Mathematics and NRICH, and taught in secondary schools for ten years. He is the series editor for the Cambridge International AS & A Level Mathematics series. |
Thank you for your feedback which will help us improve our service.
If you requested a response, we will make sure to get back to you shortly.
×